in the GUI, how do i read the rows at the top?
in the GUI, how do i read the rows at the top?
I'm trying to tune comskip with the GUI. I understand most of the graph, but the rows right under the commercial timeline at the top seem to be trying to tell me something. My commercial cut point isn't quite right and I see some black and white in the bar just under it. I'm guessing that my scoring could use adjusting to get the result I want, but I'm not totally sure.
Re: in the GUI, how do i read the rows at the top?
Did you find the tuning guide in the distribution zip file?
Re: in the GUI, how do i read the rows at the top?
Hi Erik! I did. I keep rereading it, but I'm a little slow in understanding the results and what to do with them, if I'm not getting the results I want. Here is an example:
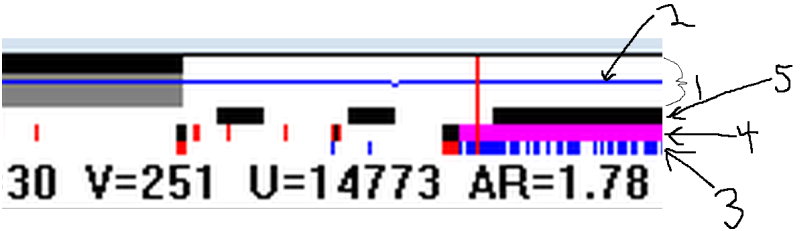
1) White is the show, grey is commercial.
2) Aspect Ratio
3) Silence detection
4) Black frame detection
5) Logo detection
Correct? So from there, I have some questions:
Why is there pink in the areas of black frame detection when the current frame (red line) is selected?
For Silence detection (#3), why is the graph red & blue? The manual suggests I should be seeing green.
How can I use this information to better tune my INI? For example, a cutpoint should exist at about the current frame (red line). Obviously it does not. So, I'm trying to understand how I can read the graph and decide what to try next for better detection. Detection mode is 47 in this case.
Thanks for any help!
Re: in the GUI, how do i read the rows at the top?
Good questions.
Pink denotes the complete blok (from cutpoint to cutpoint) you are currently in. That is why it moves with the vertical line
The silence/sound graph second to bottom is green. The top window graph is red for silence cutpoints and black when silent enough for a "video" cutpoint to qualitfy as a real cutpoint.
To understand in more detail you should also look at the graphs in "none top" part of the screen as they will turn white when a audio/video clue passes the set thresshold.